


Why Is My Electricity Bill So High in California? The 2026 Truth

California electricity bills hit record highs in 2026 despite modest rate adjustments. Time-of-Use pricing, NEM 3.0 changes, and infrastructure costs mean SCE customers now pay 58-74¢/kWh during peak hours.
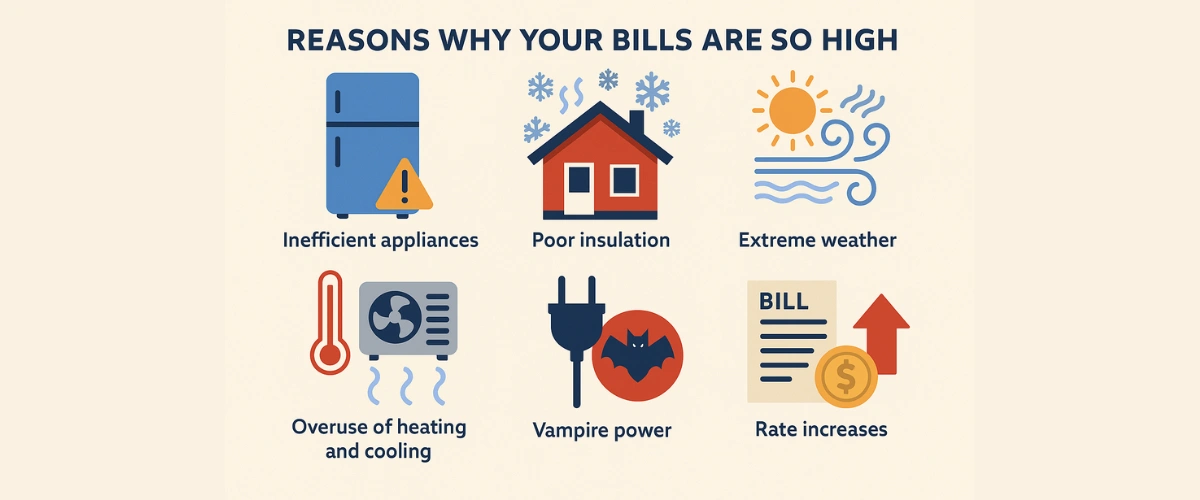
You open your SCE bill in February 2026, and your stomach drops. Despite using less electricity than last month, your bill somehow climbed another $30. The "rate decrease" Southern California Edison announced in January? It barely made a dent.
You're not alone—and you're not imagining things. California homeowners are paying some of the highest electricity rates in the nation, and the reasons go far deeper than simple supply and demand. Between Time-of-Use pricing structures, wildfire mitigation costs, and NEM 3.0's massive policy shift, Southern California's electricity landscape has fundamentally changed.
Here's what's really happening to your electricity bill in 2026—and what you can actually do about it.
The Shocking Reality of California Electricity Bills in 2026
California ranks among the top states for electricity costs, with residential rates averaging 34.5¢ per kilowatt-hour (kWh) for SCE customers as of January 2026. That's nearly double the national average of roughly 19¢/kWh.
But here's the catch: that 34.5¢ figure is an average. If you're on a Time-of-Use (TOU) rate plan—and most SCE residential customers are—you're paying wildly different rates depending on when you use power. Peak hours (4-9 PM or 5-8 PM depending on your plan) can cost you 58¢ to 74¢ per kWh. Off-peak rates drop to around 24-31¢/kWh, but most families use the majority of their electricity during those expensive evening hours.
For context, average electric bill in California homeowners now pay $210-$240 per month on average. High-usage homes—common in Southern California due to air conditioning, pool pumps, and electric vehicle charging—regularly see bills exceeding $350-$450 monthly.
The painful irony? SCE technically decreased rates in January 2026 (from 35.3¢ to 34.5¢/kWh), but most customers didn't feel relief. Why? Because October 2025's 13% rate hike more than offset the January adjustment. Your wallet remembers October; the tiny January decrease barely registers.
Want to understand the full picture of why are electricity bills so high in Southern California? It starts with understanding what's driving these relentless increases.
Why SCE and SDG&E Rates Keep Climbing (Even When They "Decrease")
Southern California Edison doesn't raise rates randomly. Every adjustment requires approval from the California Public Utilities Commission (CPUC), and these increases stem from multiple interconnected factors:
Wildfire Mitigation and Grid Safety Costs
Following devastating wildfires over the past decade, California utilities have invested billions in grid hardening, undergrounding power lines, and vegetation management. SCE alone spends hundreds of millions annually on wildfire prevention. Those costs? Passed directly to ratepayers through monthly bills.
This isn't optional spending—it's mandated by state regulators and critical for public safety. But it still means your bill funds infrastructure upgrades you'll never directly see.
Infrastructure Modernization and Maintenance
California's electrical grid is aging. Transformers, substations, and transmission lines require constant maintenance and replacement. As the grid becomes more complex—integrating renewable energy sources, managing distributed solar, supporting EV charging infrastructure—modernization costs skyrocket.
The CPUC approved SCE's 2025 General Rate Case (GRC), which included $476 million in additional funding for 2026 operations. That recovery period started appearing on October 2025 bills, creating the 13% spike many customers experienced.
The Base Services Charge Restructuring
In November 2025, SCE implemented California Assembly Bill 205's required restructuring. Residential customers now see a "Base Services Charge" as a separate line item, replacing the previous Basic Charge. While per-kWh rates theoretically decreased to offset this fixed charge, the net effect on total bills varies dramatically by household usage patterns.
High-usage homes often pay more under the new structure, while low-usage households might see modest savings. The transition has created confusion and frustration among customers trying to understand why their bills don't match the "rate decrease" headlines.
Renewable Energy Transition Investments
California's mandate to reach 100% clean energy by 2045 requires massive capital investment. Battery storage facilities, grid interconnection upgrades, and renewable energy procurement all carry costs that utilities recover through rates.
Ironically, even as distributed solar (your neighbor's rooftop panels) reduces grid demand, utilities still maintain the infrastructure to serve everyone—and those fixed costs get spread across fewer kilowatt-hours purchased from the grid, pushing per-kWh rates higher.
If you're looking for simple ways to reduce electricity bills quickly while navigating these structural challenges, there are immediate steps you can take—but the long-term solution requires a different strategy entirely.
How Time-of-Use Rates Are Draining Your Wallet
Time-of-Use (TOU) pricing isn't new, but its impact has intensified as rate spreads widen. Understanding how SCE Time-of-Use rates work is critical to managing your bills—or realizing why managing them through behavior alone is nearly impossible.
The TOU Rate Structure Breakdown
SCE offers three primary residential TOU plans:
TOU-D-4-9PM: Peak hours 4-9 PM weekdays at 58¢/kWh. Off-peak rates 24-31¢/kWh depending on season. This is the default plan for most customers.
TOU-D-5-8PM: Narrower peak window (5-8 PM) but higher rates—up to 74¢/kWh during peak. Off-peak rates similar to the 4-9 plan.
TOU-D-PRIME: Designed for solar customers with different peak windows and rate structures, but still features significant price differentials.
The problem? Most California families naturally use the most electricity during peak hours. You get home from work at 5:30 PM. You cook dinner, run the dishwasher, charge your EV, turn on the AC, do laundry, and watch TV—all between 4-9 PM when rates peak.
The Math That Doesn't Add Up
Let's say your household uses 30 kWh daily (900 kWh monthly), which is typical for a 2,000-square-foot home in Southern California. If 60% of that usage occurs during peak hours:
- Peak usage: 18 kWh/day × 58¢ = $10.44/day
- Off-peak usage: 12 kWh/day × 28¢ = $3.36/day
- Daily total: $13.80
- Monthly total: ~$414
Compare that to a flat-rate scenario at the "average" 34.5¢/kWh:
- 30 kWh/day × 34.5¢ = $10.35/day
- Monthly total: ~$310
That's over $100/month in extra costs simply because of when you use electricity—even though your total consumption didn't change.
Shifting usage to off-peak hours helps, but it's not realistic for most families. You can't cook dinner at 2 AM or wait until midnight to run your dishwasher. EV charging can shift to overnight, but that only solves one piece of the puzzle.
This is where solar—and especially solar with battery storage—becomes transformative rather than just beneficial.
The NEM 3.0 Factor: Why Solar Without Batteries Doesn't Cut It Anymore
California's Net Energy Metering 3.0 (NEM 3.0) policy, which took effect April 15, 2023, fundamentally changed solar economics. If you're considering solar in 2026, understanding NEM 3.0 is non-negotiable.
What Changed Under NEM 3.0
Under previous net metering policies (NEM 1.0 and 2.0), solar customers received full retail-rate credits for excess electricity exported to the grid. If you generated 1 kWh of solar power you didn't use, you got a credit worth whatever you'd pay to buy 1 kWh from the utility—essentially a 1:1 exchange.
NEM 3.0 slashed export compensation by approximately 75%. Instead of retail-rate credits, solar customers now receive "avoided cost" credits—basically the wholesale value of electricity at that specific time. Export credits average around 8¢/kWh, while you're still paying 34.5¢/kWh (or 58¢+ during peaks) for power you buy from the grid.
The math is brutal for solar-only systems. You export midday solar for 8¢/kWh, then buy that same electricity back at night for 35-50¢/kWh. The economics no longer work without batteries.
Why Battery Storage Became Essential
This is where understanding how solar batteries can maximize your savings becomes critical. Battery storage allows you to:
Store midday solar production instead of exporting it for pennies on the dollar.
Discharge stored energy during peak hours (4-9 PM) when grid electricity costs 58-74¢/kWh, avoiding those expensive purchases entirely.
Maximize self-consumption rather than relying on the grid's unfavorable export/import exchange rate.
A properly sized solar-plus-battery system can offset 70-90% of your electricity bill under NEM 3.0. Solar-only systems typically offset just 40-50% under the new policy—half the savings potential.
For Southern California homeowners, the question isn't "Should I get solar?" but rather "Can I afford not to get solar with batteries given these rate structures?"
The answer depends on your specific usage patterns, but for most families facing $250-$400 monthly bills, the ROI case is compelling. Especially when you consider that solar batteries are worth the cost in California with payback periods now averaging 5-7 years for cash purchases.
How US Power Helps Southern California Homeowners Fight Back
Not all solar companies are created equal—especially under NEM 3.0's challenging economics. US Power's exclusive partnership with QCells, combined with factory-direct pricing and local expertise, creates genuine advantages for Southern California homeowners.
Factory-Direct QCells Pricing: 15-20% Below Market
US Power is QCells' exclusive residential partner in Southern California, which means you're getting American-made solar panels at factory-direct pricing. No middlemen, no markup layers—just transparent pricing that's typically 15-20% below comparable systems from national installers.
QCells manufactures panels in Dalton, Georgia, ensuring quality control, American jobs, and supply chain reliability. These aren't generic import panels; they're premium Tier 1 modules with industry-leading performance warranties.
CSLB-Licensed Consultants, Not Commissioned Salespeople
Every US Power consultant holds a California State License Board (CSLB) license. They're not aggressive salespeople chasing commissions—they're licensed professionals focused on designing systems that actually work for your home and usage patterns.
This matters enormously under NEM 3.0. An oversized system wastes money. An undersized system leaves savings on the table. A system designed without understanding your TOU rate plan and peak usage habits won't deliver promised savings.
US Power's consultants analyze 12 months of your utility data, understand your rate plan, account for future electrification (EVs, heat pumps), and design systems optimized for maximum ROI under NEM 3.0's economics.
25-Year Comprehensive Warranty
Most solar companies offer separate warranties: 25 years on panels, 10-12 years on inverters, maybe 10 years on workmanship. US Power bundles everything into a single 25-year comprehensive warranty covering panels, inverters, batteries, and installation workmanship.
One warranty. One responsible party. No finger-pointing between manufacturers and installers when something needs service.
3-6 Week Installation Timeline
While many national installers quote 3-6 month timelines, US Power averages 3-6 weeks from contract signing to Permission to Operate (PTO). This speed matters in 2026 because every month you delay is another month paying peak electricity rates instead of banking savings.
The faster timeline stems from US Power's local focus, direct manufacturer relationship, and experienced permitting team familiar with every Southern California jurisdiction's specific requirements.
Want to understand why QCells is the smartest choice for your home? It starts with quality manufacturing, but it extends through every aspect of the installation and ownership experience.
Not sure where to start? Learning how to choose a solar company in Los Angeles helps you evaluate options and ask the right questions—whether you ultimately choose US Power or another installer.
Real Savings Scenarios: What You Could Actually Save
Let's move beyond hypotheticals and look at realistic savings projections for typical Southern California homes in 2026.
Scenario 1: 2,000 sq ft Home in Los Angeles County
Current monthly bill: $280 (850 kWh usage)
Recommended system: 8.4 kW solar + 13.5 kWh battery
Factory-direct system cost: $32,000
Projected monthly bill after solar: $35-$50 (grid connection fees + minimal usage)
Monthly savings: ~$230
Annual savings: ~$2,760
Payback period: 8-9 years (cash purchase)
25-year savings: $69,000+
Scenario 2: 2,500 sq ft Home with EV in Orange County
Current monthly bill: $420 (1,200 kWh usage including EV charging)
Recommended system: 12.6 kW solar + 27 kWh battery (two units)
Factory-direct system cost: $48,000
Projected monthly bill after solar: $45-$65
Monthly savings: ~$355
Annual savings: ~$4,260
Payback period: 7-8 years (cash purchase)
25-year savings: $106,500+
Scenario 3: 3,200 sq ft Home in Ventura County
Current monthly bill: $510 (1,500 kWh usage)
Recommended system: 15 kW solar + 27 kWh battery
Factory-direct system cost: $56,000
Projected monthly bill after solar: $50-$75
Monthly savings: ~$435
Annual savings: ~$5,220
Payback period: 6-7 years (cash purchase)
25-year savings: $130,500+
These projections assume:
- Continued 3-5% annual electricity rate increases
- Proper system sizing and battery dispatch optimization
- NEM 3.0 export credits at current rates
- Cash purchases (financing extends payback but preserves total savings)
The key insight? Higher current bills mean faster payback and greater total savings. If you're already paying $350+ monthly, solar with batteries isn't just a good investment—it's arguably irresponsible not to explore it.
Your Path Forward: Taking Control Before the Next Rate Hike
California electricity rates aren't going down. Infrastructure costs, wildfire mitigation, and grid modernization will continue driving rates upward for years to come. The question isn't whether rates will rise—it's how much you'll pay before you take control.
Solar with battery storage isn't a future technology or experimental concept. It's a proven solution that thousands of Southern California homeowners use right now to slash electricity costs while gaining energy independence and grid resilience.
US Power's factory-direct QCells pricing, comprehensive warranties, and 3-6 week installation timelines make the transition faster and more affordable than you might expect. CSLB-licensed consultants design systems optimized for your specific home, usage patterns, and financial goals—no pressure, no gimmicks, just transparent information.
The next SCE rate increase is coming. The only question is whether you'll be paying it or avoiding it.
Frequently Asked Questions
Why did my electricity bill go up even though I used less power?
Are California electricity rates going to keep increasing?
Can solar really eliminate my electricity bill completely?
What happens if electricity rates drop after I install solar?
Is it better to wait for solar technology to improve or prices to drop?
How California Homeowners Can Control Energy Costs with Solar
Get Smart, start controlling your energy costs before utility rates rise further!
How Much Is the Average Electric Bill in California?
Learn California's average electric bill and reduce costs by switching to solar.

The Smartest Ways to Pay for Solar—and Maximize Your Savings
Learn strategies to finance solar and get the most savings on your investment.


Derechos de autor © 2025 US POWER | Energía solar y techosUS Power - Axia by QCells. All Rights Reserved.
¡Obtenga una estimación solar instantánea usando el satélite!